Stop Guessing Why Your API Calls Fail
API Error Decoder automatically captures every failing request, classifies the error, and tells you exactly why — with likely causes and suggested fixes.
Sound familiar?
Every developer has lost hours to these exact problems.
You see a red request in DevTools but no idea why
A generic "401 Unauthorized" tells you nothing. Is it an expired token, wrong scope, or a missing header? DevTools won't say.
You waste 20 minutes reading docs to understand a 401
Every auth error sends you down a documentation rabbit hole before you can even begin to debug the actual problem.
You copy-paste headers into Postman just to replay a request
Manually reconstructing a failing request is tedious and error-prone. You lose time every single time.
How It Works
From install to first diagnosis in under a minute.
Click "Start Capture"
Activate the extension in the DevTools side panel. No configuration needed — it starts listening immediately.
Browse Your Site
Use your app normally. Every failing API call is captured automatically — 4xx, 5xx, CORS, and network errors.
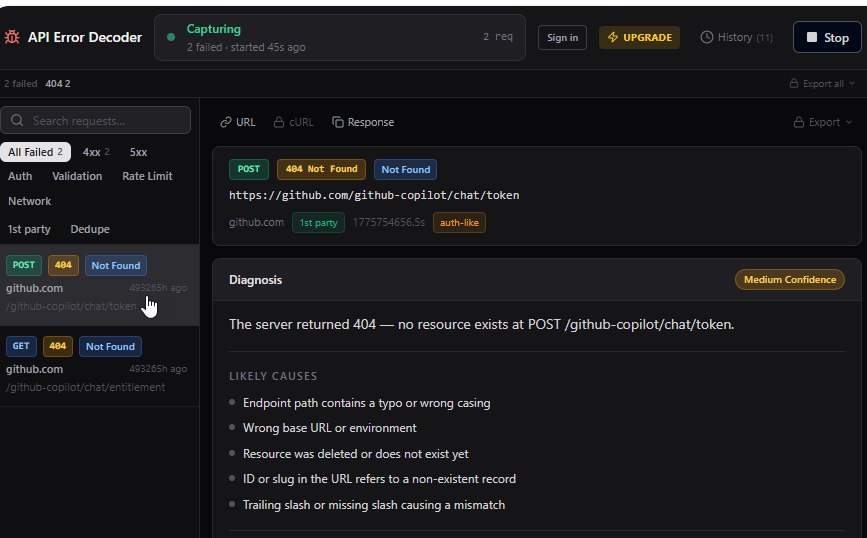
Click Any Request
See the full diagnosis: error classification, likely causes, JWT token inspection, and step-by-step fix suggestions.
Everything You Need to Debug API Errors
Built for frontend and full-stack developers who want answers, not guesswork.
Automatic Error Capture
Captures 401, 403, 404, 422, 429, 5xx, CORS, and network errors the moment they fire. No setup required.
Error Classification & Diagnosis
Every error is classified and explained. See the error type, likely root cause, and what to check next.
Headers & Response Viewer
Inspect request headers and response bodies with JSON syntax highlighting. All in one panel.
Session History
Review your current session of captured errors. Upgrade to Pro for unlimited session history.
Request Replay
Edit headers, body, and query params — then resend the request directly from the panel.
JWT Inspection
Decode JWT tokens, check expiry, view all claims, and get instant feedback when your token is expired or malformed.
Export (cURL, Postman, JSON)
Export any captured request as a cURL command, Postman v2.1 collection, or a Debug JSON report.
Privacy First
All captured data stays in your browser. Nothing is sent to any server. Ever.
Free vs Pro
Start free. Upgrade once — no subscription, ever.
Free
- Automatic error capture (401, 403, 404, 422, 429, 5xx, CORS, network)
- Error classification with diagnosis
- Request headers & response body viewer
- Session history (current session)
- Request Replay — edit headers, body, and resend
- JWT Inspection — decode token, check expiry, view claims
- Export to cURL, Postman v2.1, Debug JSON
- Unlimited session history
- Copy cURL command
Pro
No subscription · Pay once · All future updates included
Upgrade to Pro — $19- Automatic error capture (401, 403, 404, 422, 429, 5xx, CORS, network)
- Error classification with diagnosis
- Request headers & response body viewer
- Session history (current session)
- Request Replay — edit headers, body, and resendPRO
- JWT Inspection — decode token, check expiry, view claimsPRO
- Export to cURL, Postman v2.1, Debug JSONPRO
- Unlimited session historyPRO
- Copy cURL commandPRO
Free tier available — install and start capturing for free
Your data never leaves your device
All captured request data stays in your browser. Nothing is sent to any server — no cloud storage, no tracking, no analytics on your API calls.
Open side panel architecture — processes entirely on your device.
Frequently Asked Questions
Does it work on all websites?
Does it slow down my browser?
Is my data sent anywhere?
What's the difference between Free and Pro?
Is the lifetime deal really lifetime?
Start debugging smarter today
Install API Error Decoder and never stare at a red request wondering why it failed.
Add to Chrome — It's Free